Turn any data source into a live chart widget
KnowMine graph widgets can pull data directly from your own API. Point them at a URL, pick a chart type, and watch your dashboard come alive.
How it works
Configure your endpoint
Enter your API URL directly in the widget settings. You can use any HTTP or HTTPS endpoint that returns a valid JSON response.
Pick a chart type
Choose from 9 chart types — bar, pie, area, time series, stacked bar, radial gauge, circular progress, and KPI metric.
Live updates
The widget polls your endpoint automatically at the configured interval (5–60 seconds). Your dashboard always shows fresh data.
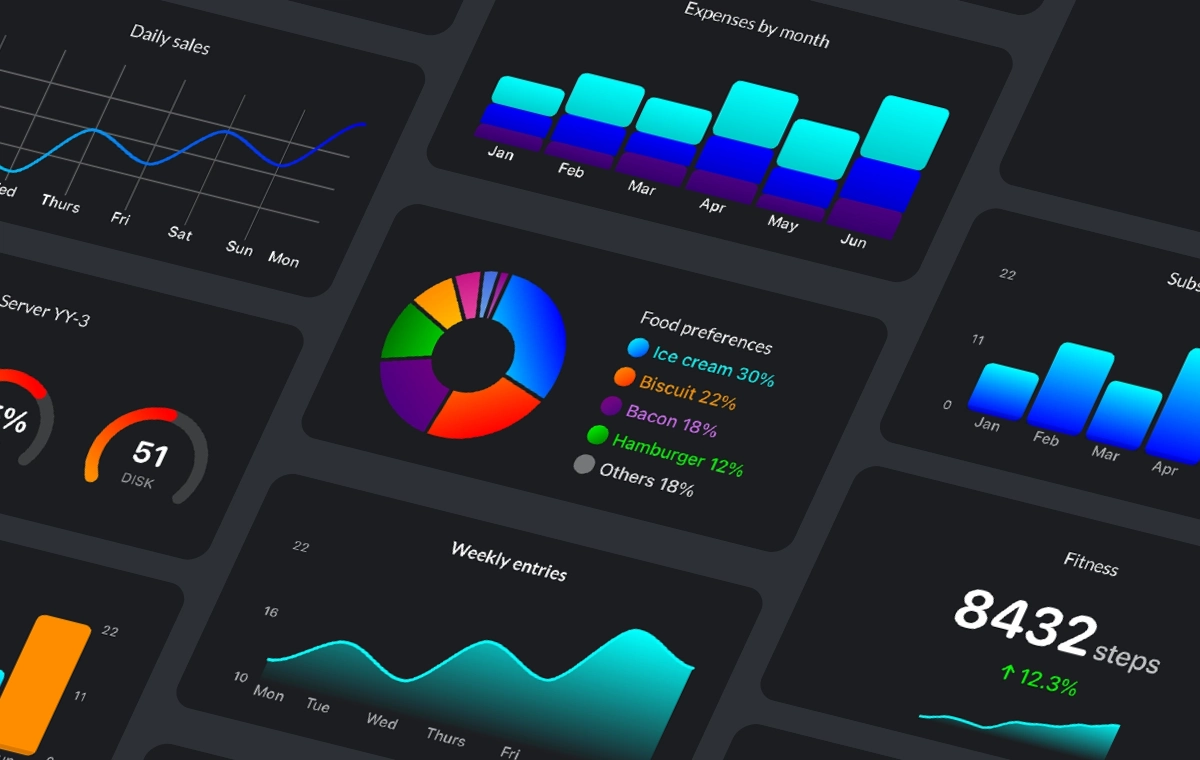
9 chart types, ready to use
Each widget type maps to a specific JSON structure. All types share the same response envelope.
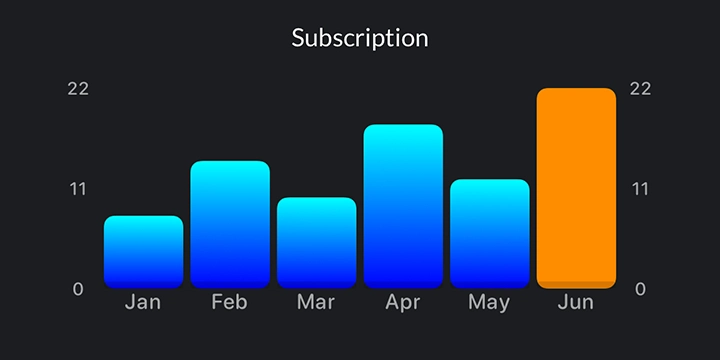
Bar Chart
Vertical bars with highlight support and optional Y-axis labels.
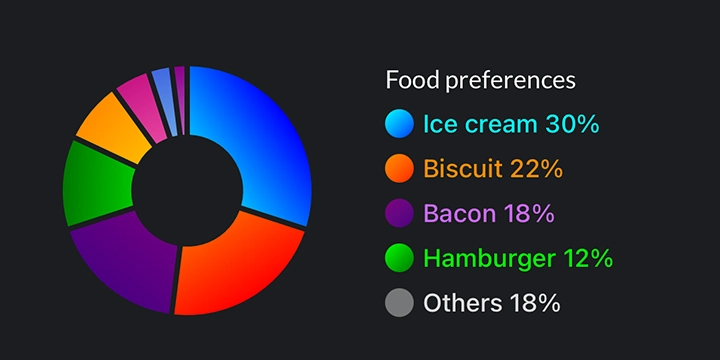
Pie Chart
Full pie or donut with optional legend. Slices auto-aggregate when >5.
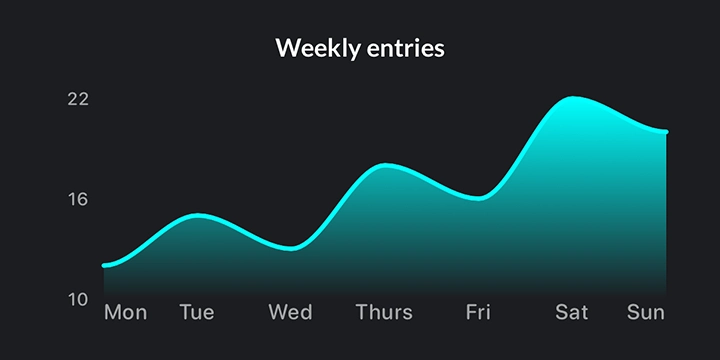
Area Chart
Trend area with gradient fill and optional smooth curve.
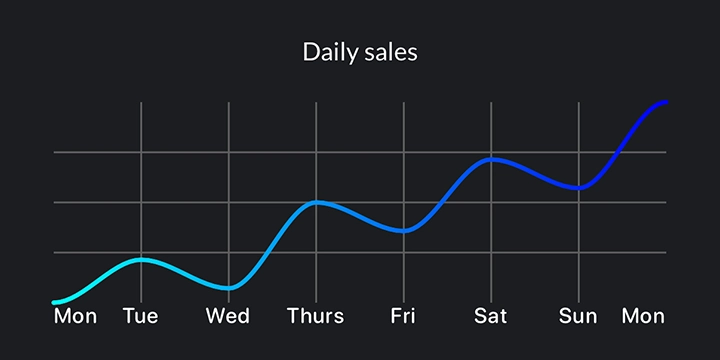
Time Series
Line chart with horizontal gradient and optional background grid.
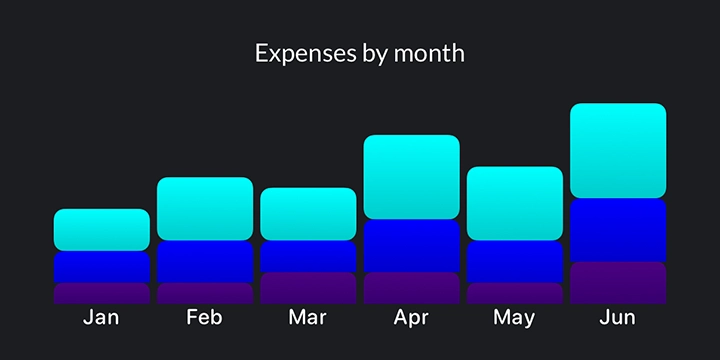
Stacked Bar
Multi-series stacked bars for part-to-whole visualization.
Radial Gauge
Arc gauge with color thresholds, ticks, and center value.
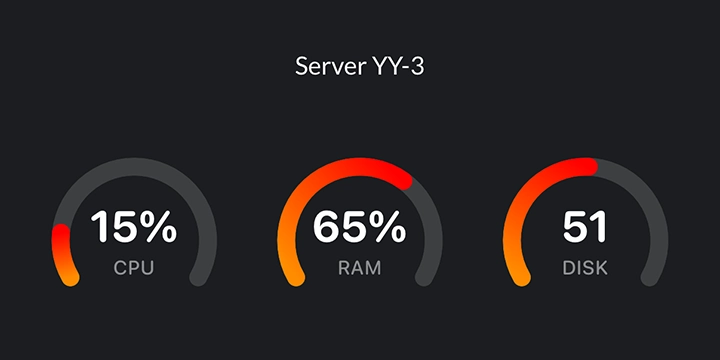
Radial Gauge Large
2 or 3 side-by-side gauges on a single widget.
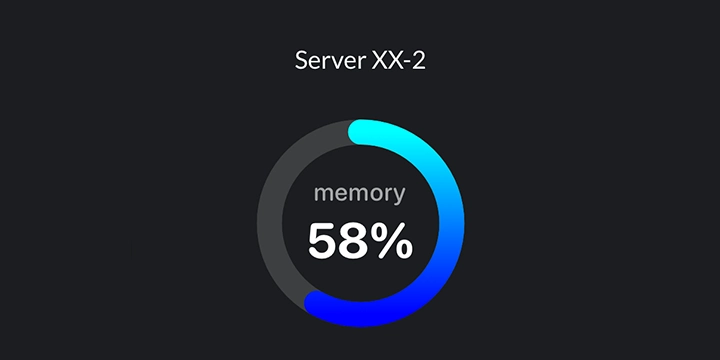
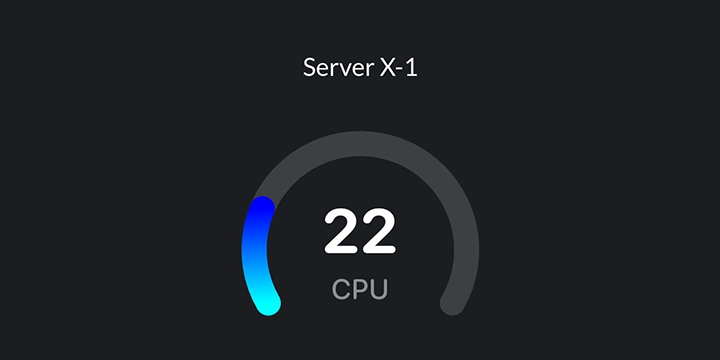
Circular Progress
Full 360° ring for progress, goals, and percentages.
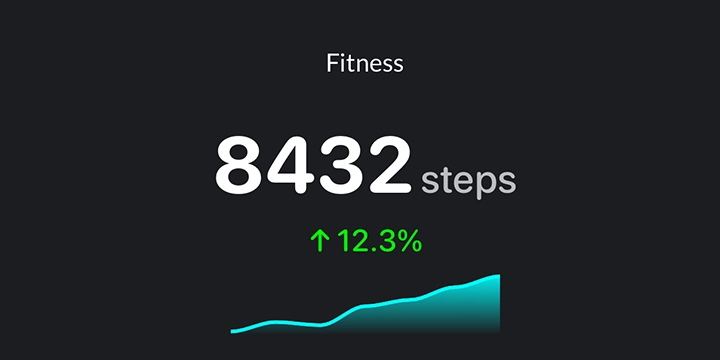
KPI Metric
Primary value with trend indicator and embedded sparkline.
Secure your API
Graph widgets support four authentication methods to connect to protected endpoints.
None
Public APIs with no authentication required. Just enter the URL and go.
Bearer Token
Standard OAuth2 / JWT token authentication. The app sends your token in the Authorization header.
Basic Auth
Username and password authentication. Credentials are sent encoded in the Authorization header.
API Key
Custom key/value pair. Specify the header name and your API key. Supports any custom header.
The knowmine-graphs library
We maintain an open source Node.js library — knowmine-graphs — that makes it straightforward to build API endpoints compatible with KnowMine chart widgets.
- Ready-made DTO builders for all 9 chart types
- Server monitoring helpers (CPU, memory, disk, network)
- Express.js compatible
- Zero dependencies on the core library
The library is completely optional. If you prefer, you can build your own compatible API using any language or framework. The DTO Reference documents exactly what JSON structure each widget expects.
const { BarChart } = require('knowmine-graphs');

app.get('/api/sales', (req, res) => {
  res.json(BarChart.build({
    name: 'Monthly Sales',
    values: [8, 14, 10, 18, 12, 22],
    labels: ['Jan', 'Feb', 'Mar', 'Apr', 'May', 'Jun'],
    barColor: { type: 'Gradient',
      primaryColor: '#ED76F1',
      secondaryColor: '#2D6BF8' }
  }));
});